
Hello, again!
On Board #12 I used a dataset that brings information on Google Play Store, more specifically on 10841 apps available on it.
The columns available in the dataset were: app, category, size, type, content rating, # of reviews, # of intallations, rating, prices, genre, android version.
As some of the data were a bit hard for me to make better, the dashboard turned out simple, let’s see.
Questions & Answers
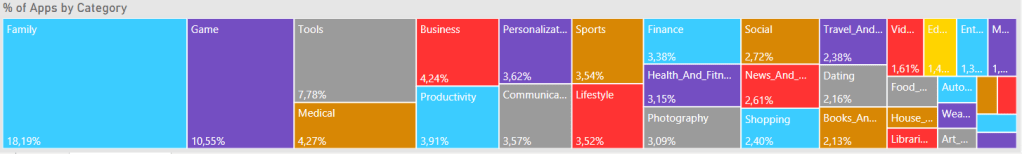
On the bottom I created a treemap so we can see how many % of the apps were fitting in each category. With 18%, “Family” is the main category, with “Game” coming after. As there are many categories, lots of them ended up between 1% – 3%.
One thing to consider is that “Family” seems like a very broad category, so probably some apps that were put inside of it could also fit in other categories and change this scenery. With that said, we should understand that more “general” apps are the majority, instead of immediately assuming 18% of the apps are truly about family.
In the rest of the board, I made some infomational charts, that can be filtered by “category” and “game genre” filters on top of the board (check them in the bigger picture earlier).
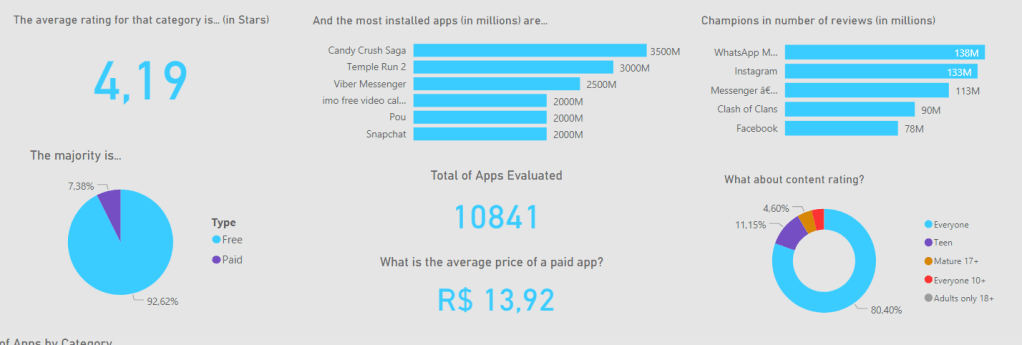
- Average rating for a category, based on the stars average for each app. The general (for all) rating is 4.19.
- # of installations in millions: This one is tricky, as I noticed some important apps are not showing up properly. For example, Whatsapp and Instagram show way less installs in the chart as Viber. Still, I left it there, as we can still see some known powerhouses of downloads such as Candy Crush, Temple Run and Pou.
- # of reviews: This one seems about right, as we see the most popular apps grabbing the top of the list. As the most popular, they end up also becoming the ones we want to complain about/make compliments the most.
- Free x Paid: It gets more interesting when we filter and see how in certain categories the % of paid apps grows significantly, while in some others it is almost 0.
- Average price: With filter we can see the most expensive and cheapest categories.
- Content rating: “Everyone” dominates, but categories such as “Dating” tell you a different story.
- Total of apps evaluated: With filter we can see how many apps are evaluated for that specific category.
Concluding…
As much as it took some good effort on my brain for this one, I had fun and am happy at the result, as it does seem helpful! Hope one day I’m able to gather more information on this, so I can make a better version (also considering my skills develop until then haha)!
See you next time. 🙂

Um comentário em “Board #12: Google Play Store Apps Analysis – Power BI”