Board #11: 1 year into my Spotify – Power BI

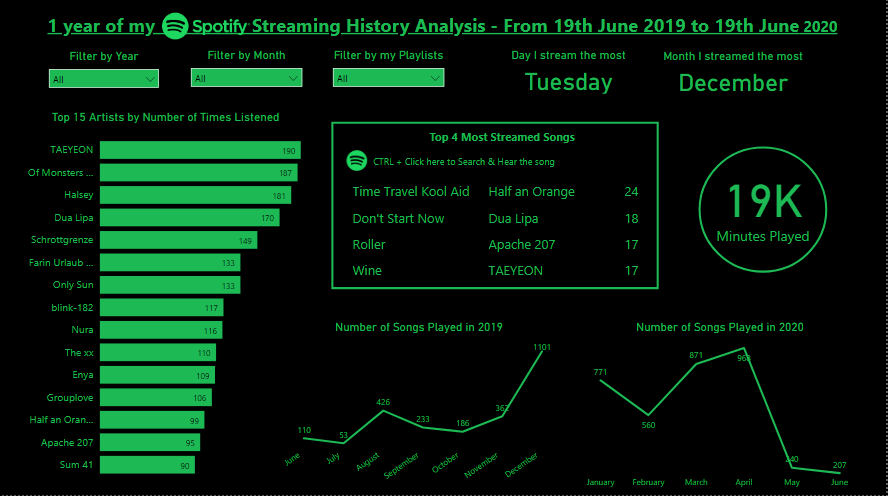
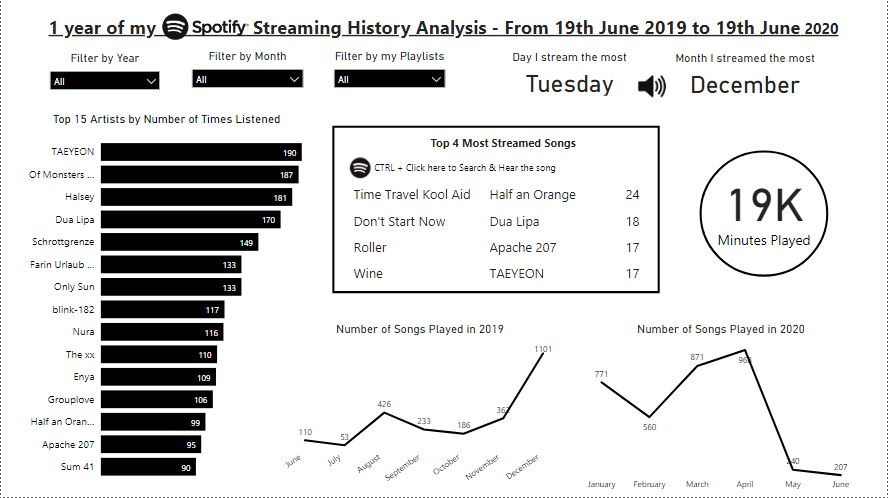
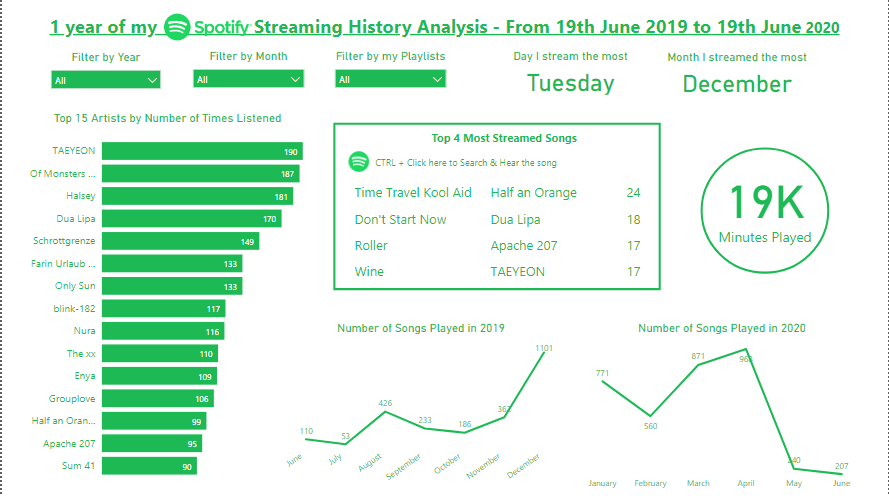
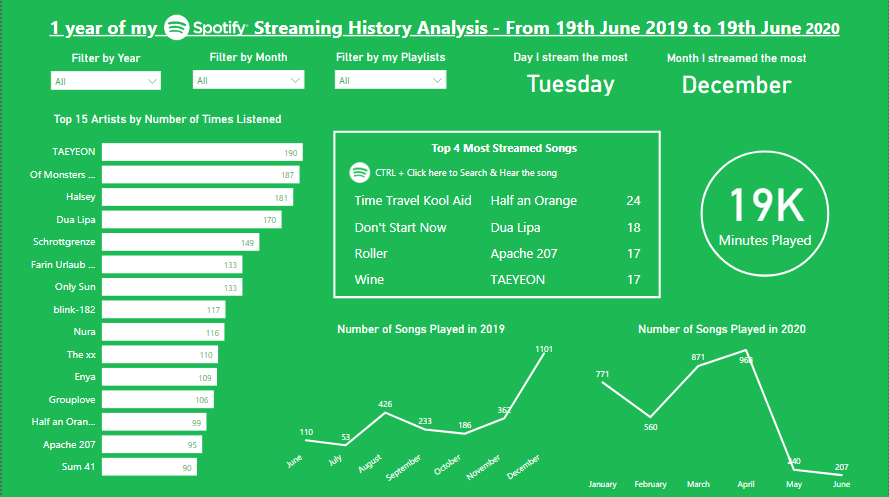
Same board with different color choices

Hello!

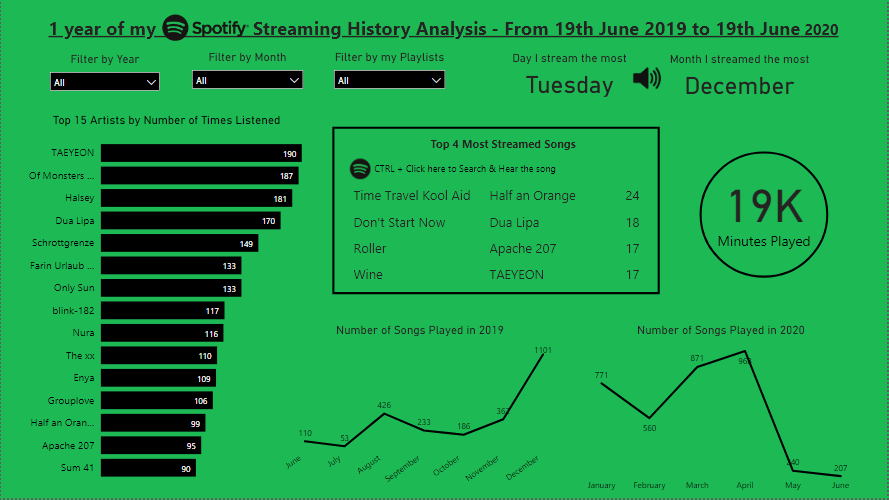
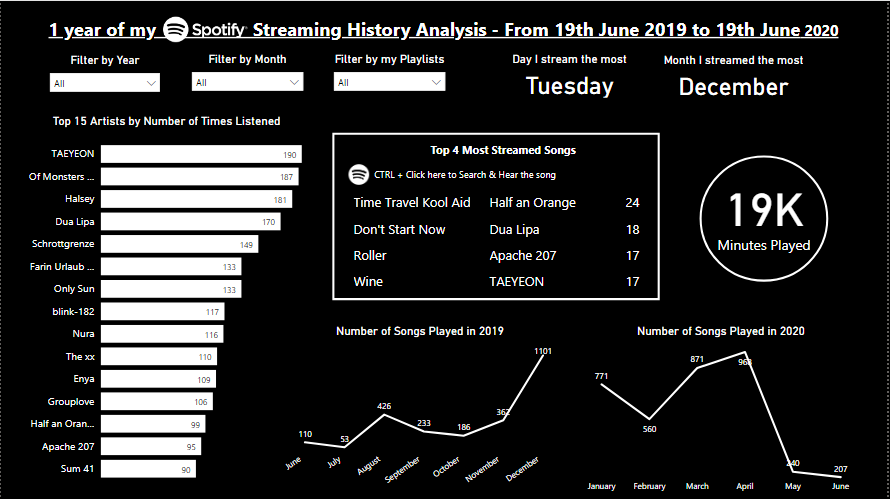
I’m back with a new simple board made on Power BI, this time using my Spotify data (19/06/19 – 19/06/20)!

In case you don’t know, you can request for your data on Spotify’s website, then you receive cool data like: your streaming history, dates, playlists sheet, search queries, followers, payments.

As my activity on Spotify resumes to streaming (no followers, no payments…), I focused on analyzing my artists, songs and habits. Let’s see what I’ve got!

Continue lendo “Board #11: 1 year into my Spotify – Power BI”

Board #10: Pokemon Stats and Pokedex on Power BI

Hello!

On this post I bring a new tool to play with: Power BI!

Power BI is a Business Analytics service by Microsoft, and it’s mainly used to produce interactive business reports and visualizations. I started learning it because I thought it would be a good “upgrade” from excel dashboards.

My first Power BI dashboard is about Pokemon, using the same dataset from the Pokemon excel dashboard (check it here). The goal was to create 1 board with general information about pokemon and 1 board to act as a pokedex, so let’s see how they turned out.

Tools used: Power BI – Charts, Cards, Filters

Continue lendo “Board #10: Pokemon Stats and Pokedex on Power BI”

Board #9: Overview of r/travel’s 2018 Survey

Hello!

On this post we’re going to check on my favorite work on Excel so far, and also the biggest one (3 boards). This was done some good time after my last board, which was a time when I was focusing on learning other things, and I believe it shows a lot of growth when we compare it to the previous posts. It’s more analytical, which made me proud and excited to learn more. (:

The data for these boards was a formulary (google forms) answered by 858 people who are part of the r/travel subreddit. It contained a lot of columns, so I’d rather leave the link for you to see here.

My idea for the boards was to:

  • 1st: Identify the main persona answering the formulary
  • 2nd: Identify their habits when traveling
  • 3rd: Cross both information to get some deeper insights

Tools Used: MS Excel – Charts, Pivot Tables; VBA (msgbox)

Continue lendo “Board #9: Overview of r/travel’s 2018 Survey”

Board #8: Fun with Pokemon Stats!

Hello!

I’m back with one of the things I love the most in the world: Pokemon! #nerd

There was no way I wouldn’t think about practicing Dashboards with Pokemon, so I pushed myself to go far on nostalgia to design this one. I found the dataset online long ago (I believe on Kaggle?) and it contained:

  • Pokemon name, Generation, types (main type, secondary type);
  • If the pokemon is legendary or not; If the pokemon has Mega or not;
  • Pokemon stats: HP, Attack, Defense, Speed, Special Attack, Special Defense, Total.
    • The stats are from the Pokemon Games released for GameBoy/Nintendo DS (Red/Blue, Gold/Silver…)

Tools Used: MS Excel – Pivot Table, Charts; VBA (msgbox)

Continue lendo “Board #8: Fun with Pokemon Stats!”

Board #7: Digging Horror Movies Jumpscares

Hello!

This ~spooky~ board will take us on a knowledge ride about horror movies through 6 decades, bringing informative cards and a chart that brings a simple conclusion.

The dataset used for this is from a challenge offered by r/dataisbeautiful on Reddit and it contains the following columns:

  • Movie, Year, Director
  • Jump count – How many scenes that cause a jumpscare exist
  • Jumpscare rating – If the jumpscares are good (5) or not (1)
  • If it is on Netflix (US) – Yes or No
  • IMDB score – 0 to 100

Tools Used: MS Excel – Charts (Scatterplot, Bars), Pivot Table

Continue lendo “Board #7: Digging Horror Movies Jumpscares”

Board #5: Visualizing Caffeine Presence on Drinks

Hello!

In this post we are going to talk about the presence of Caffeine in certain drinks/substances we take, as well as check the daily limit and the consequences of overdoing it.

The dataset for this came from a challenge on a subreddit (r/dataisbeautiful) and it contains only 3 colums of information, being them:

  • Item (drink, food, medicament, etc)
  • Quantity avaliated
  • Total Caffeine in the quantity
  • Column added by me: Quantity of item until 400mg* of caffeine is reached

*400 mg = Maximum dose of caffeine recommended in 1 day

Tools used: MS Excel – Charts, Pivot Tables, VBA

Continue lendo “Board #5: Visualizing Caffeine Presence on Drinks”

Board #4: Bundesliga Curiosities

Hello!

On this post we are going to check on another football dashboard, but this time featuring the german football league: Bundesliga!

For this analysis we have a long time range, with data from 1993 to 2018, but a shorter number of columns to analyze, being them:

  • Date and Season
  • Games: Home Team and Away Team
  • Scores: Goals from home, goals from away, game winner (Home, Away or Draw)

Tools used: MS Excel – Charts, Pivot Table

Continue lendo “Board #4: Bundesliga Curiosities”

Board #3: Curiosidades do Brasileirão

Olá!

Neste post vamos falar sobre o esporte mais “cultuado” no Brasil, o futebol, utilizando dados sobre as edições do Brasileirão entre 2008 e 2017. Diferente dos boards anteriores, este é estático, ou seja, não tem filtros que modifiquem os gráficos.

Dados disponíveis:

  • Anos, times, posições
  • Número de jogos, vitórias, derrotas e empates
  • Saldo de gols, gols sofridos, gols feitos
  • Número de jogadores geral e estrangeiros, idade média dos jogadores

Ferramenta utilizada: MS Excel – Gráficos e Tabela Dinâmica

Continue lendo “Board #3: Curiosidades do Brasileirão”

Board #2: Análise de Vendas Simples

Olá!

Nosso board nº 2 é uma simples planilha com informações de vendas de uma empresa “X”, onde encontramos:

  • Totais de vendas por vendedor, produto e mensal
  • Vendas por estado e região do Brasil
  • Vendas por cliente

Este board foi feito por mim como prática durante o curso de Excel + Dashboards, realizado em 2019.

Ferramenta utilizada: MS Excel – Tabela Dinâmica, Gráficos, Slicers

Continue lendo “Board #2: Análise de Vendas Simples”