

Hello!
On this post I bring a new tool to play with: Power BI!
Power BI is a Business Analytics service by Microsoft, and it’s mainly used to produce interactive business reports and visualizations. I started learning it because I thought it would be a good “upgrade” from excel dashboards.
My first Power BI dashboard is about Pokemon, using the same dataset from the Pokemon excel dashboard (check it here). The goal was to create 1 board with general information about pokemon and 1 board to act as a pokedex, so let’s see how they turned out.
Tools used: Power BI – Charts, Cards, Filters
Questions & Answers
The Cover
I wanted to have a simple cover, so the viewer wouldn’t open the file and immediately see a lot of charts. The “Board for Stats Enthusiasts!” was made with a Pokemon font that I downloaded and the running Pikachu comes from my need to make it flashy. The 2 buttons in the center take you to the other pages of the report when you ctrl+click.
The Pokemon Board
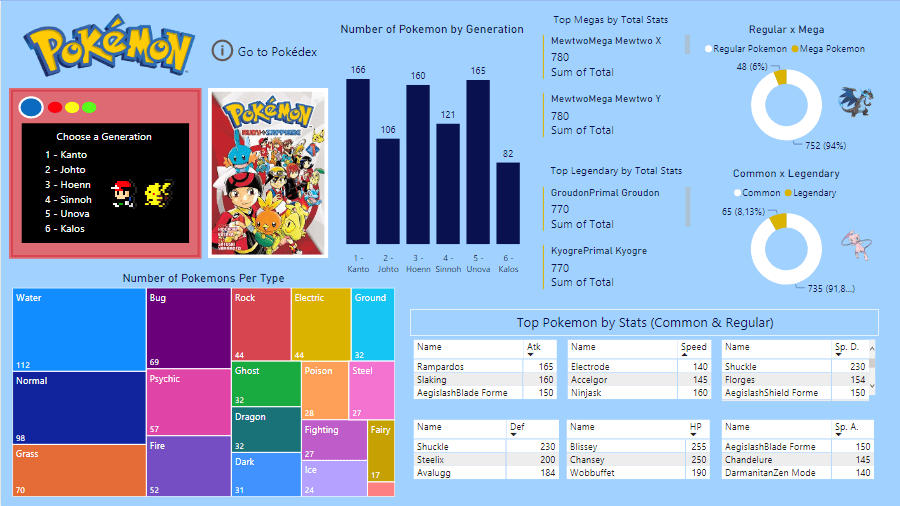
The Pokemon Board has a lot of elements that filter each other, causing all these “changes” whenever I click a filter. Here is a list of the elements and the visuals used to build them (in parentheses):
- Region/Generation – Kanto, Johto, Hoenn, Sinnoh, Unova, Kalos (Slicer)
- Pictures (Manga covers) to represent each region (Image by Cloudscope)
- Chart with the number of Pokemons that were created for each region (Column Chart)
- Top 3 Megas and Top 3 Legendaries (Multi-row Cards)
- % of Megas and % of Legendaries found (Donut Charts)
- Distribution of Pokemons per type (Treemap)
- Top 3 pokemons by each stat (Matrix)
The goal of the board is to deliver information, so there are no analysis or calculations in it. The viewer takes the information and works with it. In order to squeeze the most infomation possible from the data, I worked hard on making sure the filters would work.
Clicking on every element will filter the others, so if I want to know the best Fire pokemons in Gen.3 by stats, I click: Slicer: HOENN > Treemap: FIRE. After that, only fire pokemons will appear in the matrixes. See below:
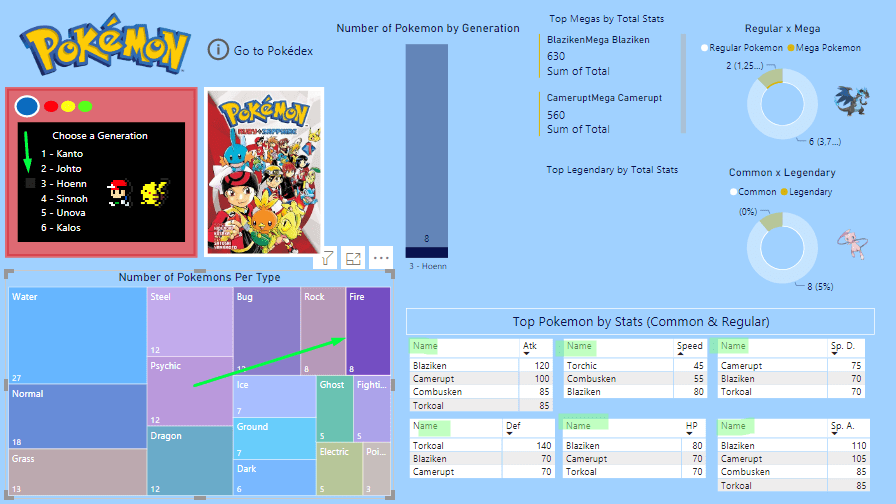
In that image, we can also see that there are only 8 fire pokemon in Hoenn (Column chart), there are no fire legendaries and 2 fire Megas (Blaziken/Camerupt).
It’s truly interesting to play with the filters here. Wish I could show you more, but I can’t upload my Power Bi dashboard online, as I’m not a premium member. ):
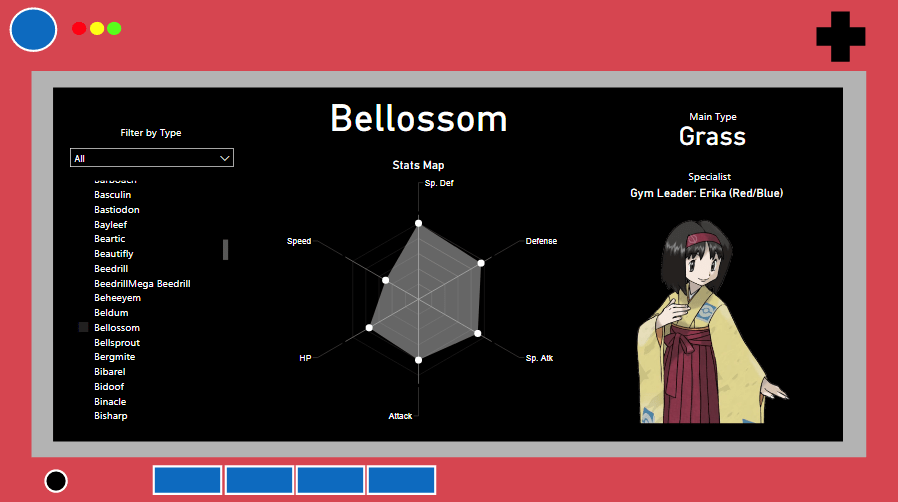
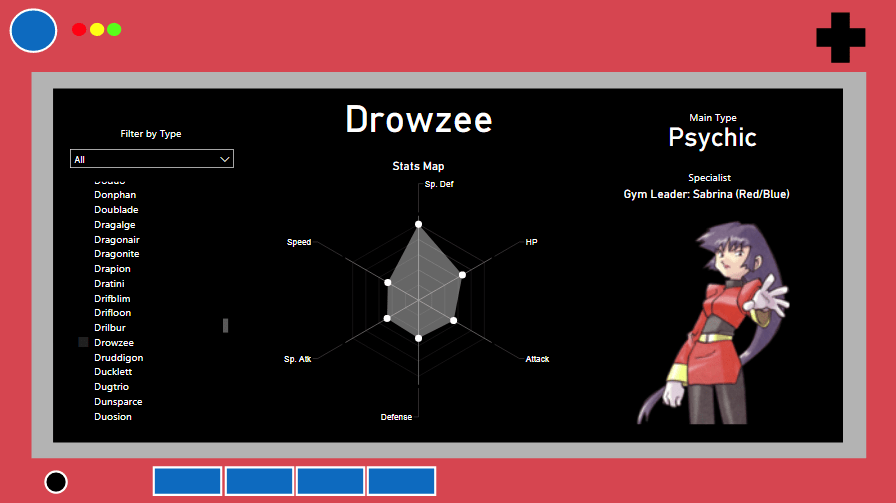
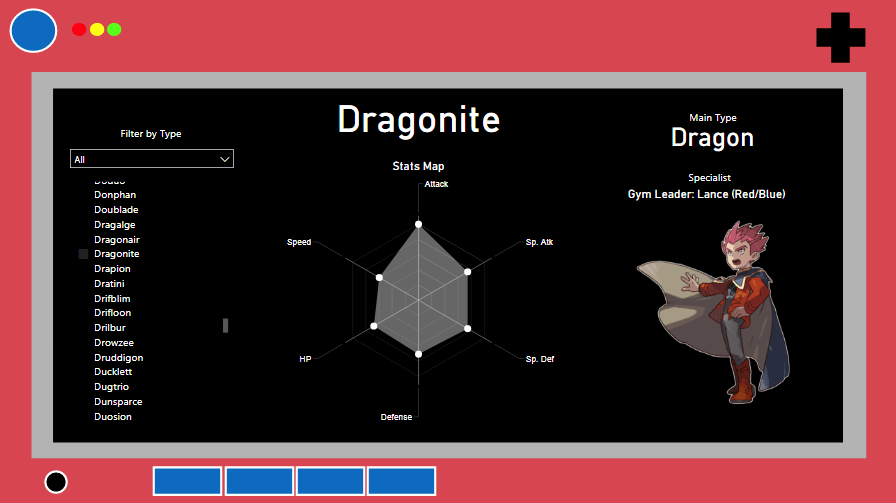
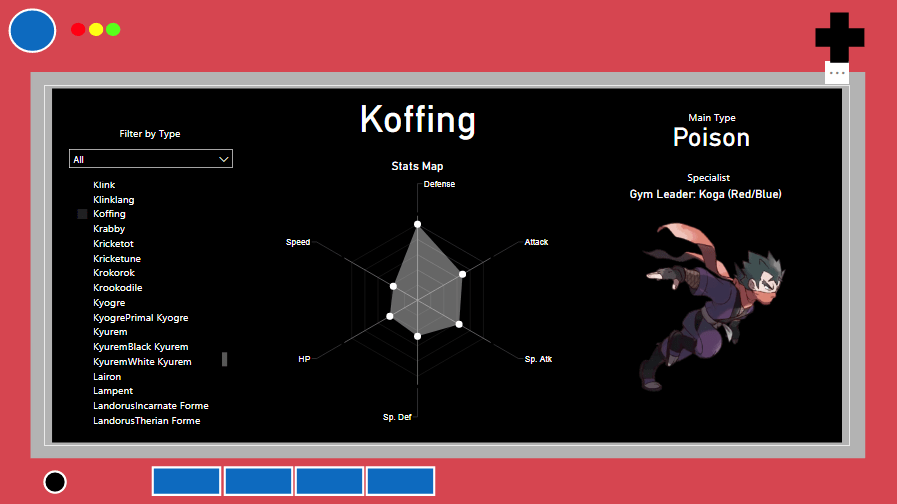
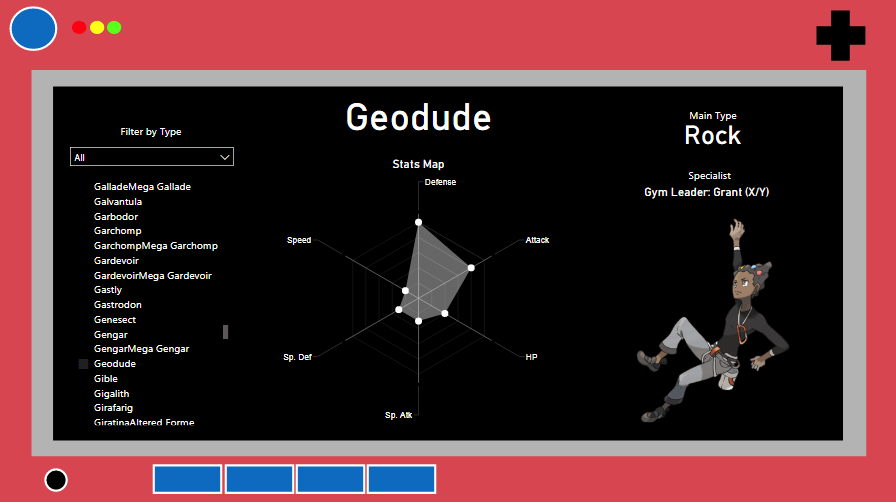
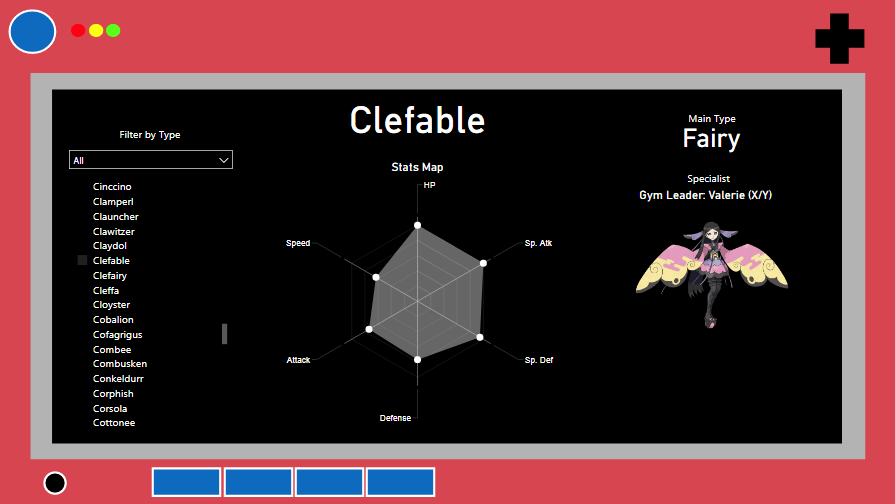
Stats Pokedex
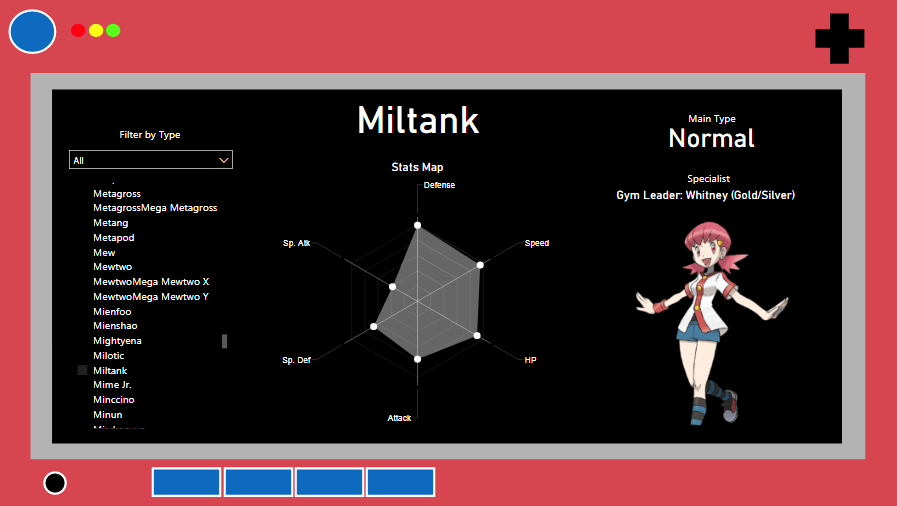
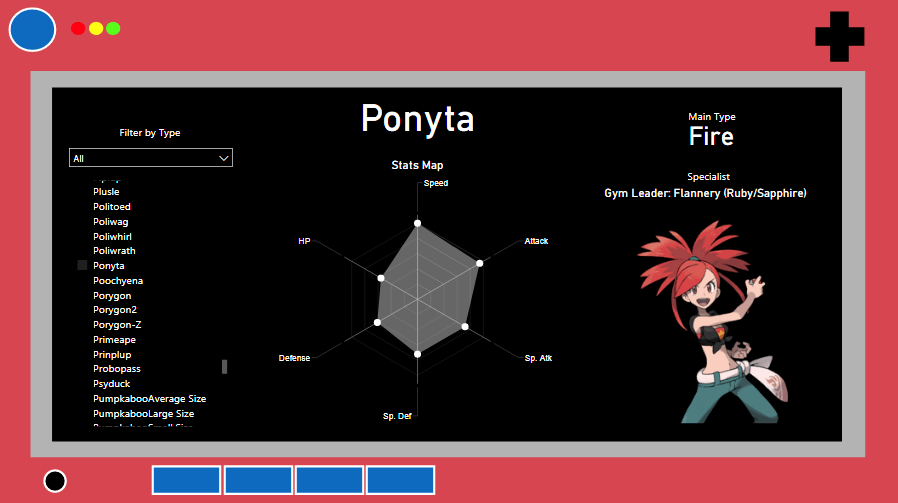
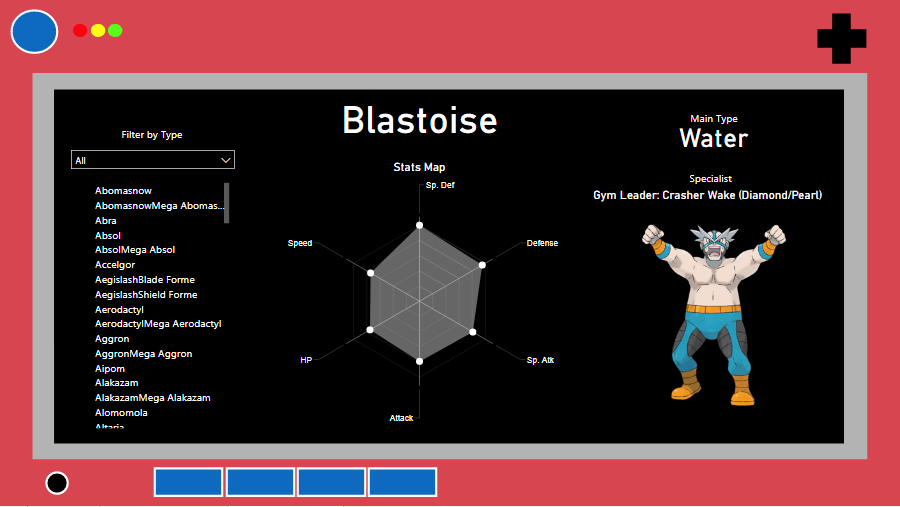
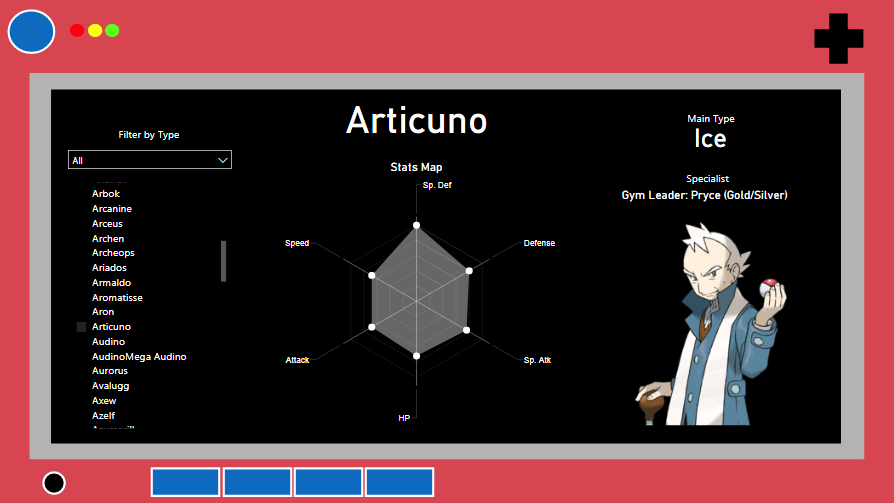
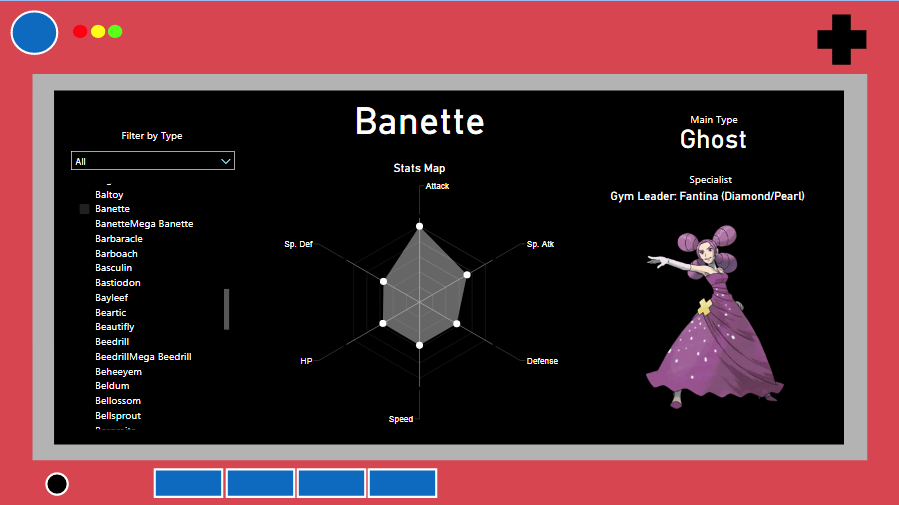
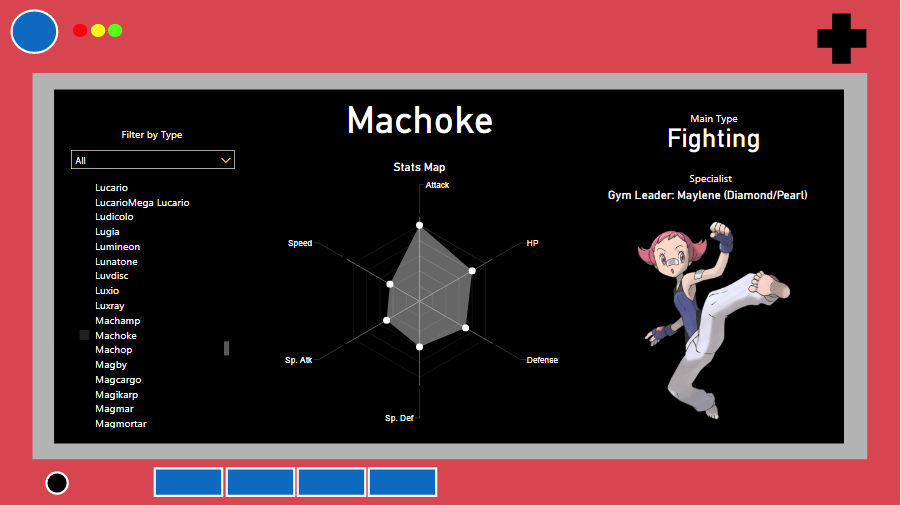
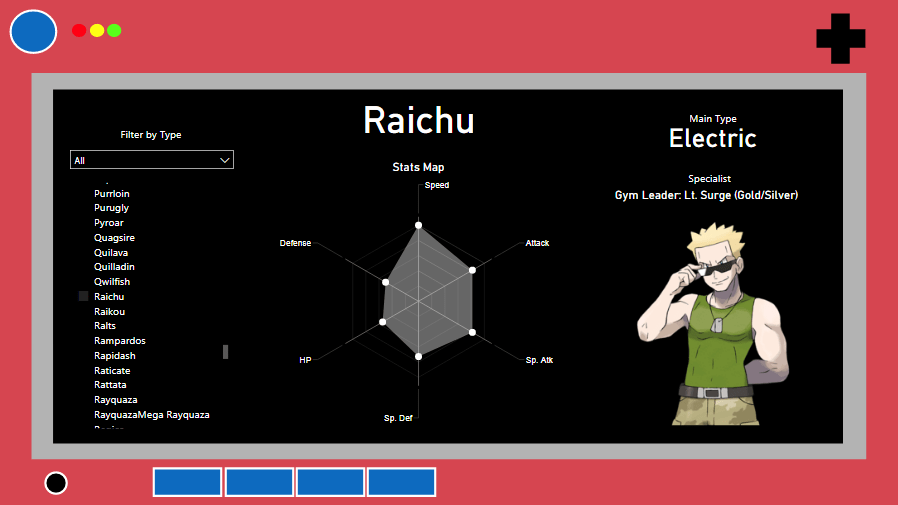
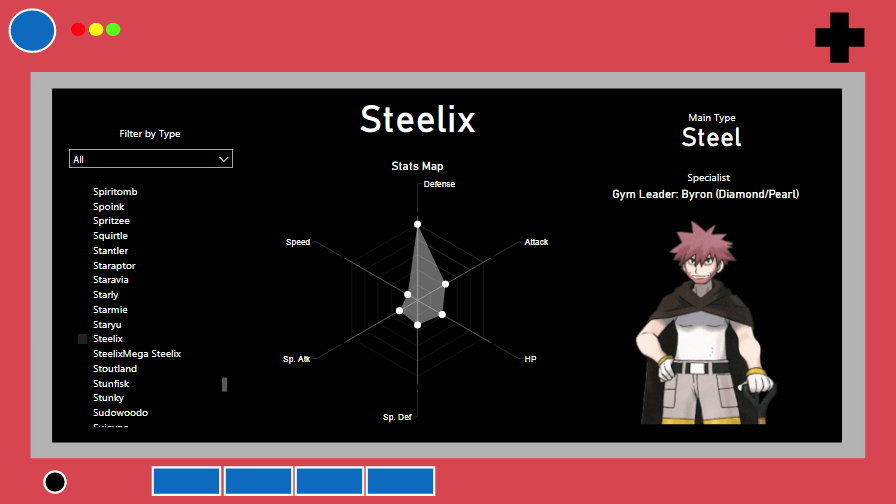
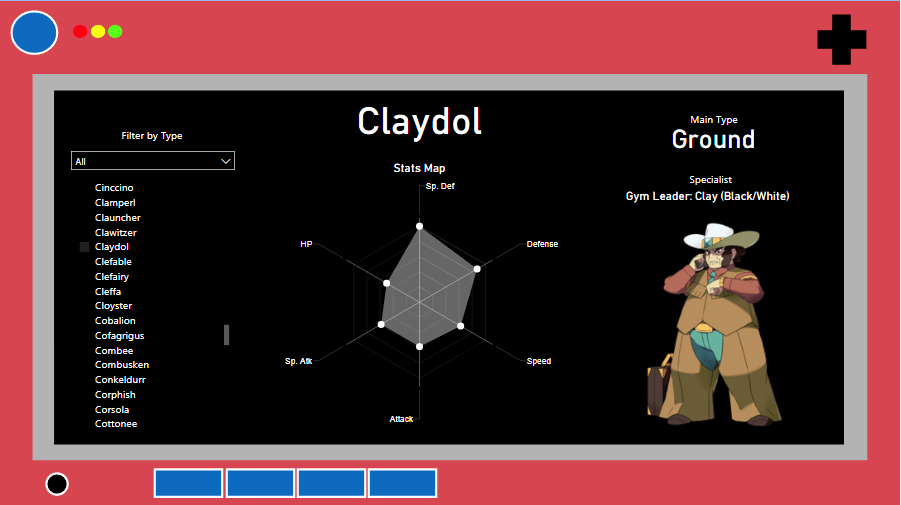
The stats pokedex is simple to use:
- Click on a pokemon and it will show you a radar chart with stats + the picture of a trainer who specializes in that type of pokemon.
- You can also choose a specific type you’d like to check on the “Filter by Type” drop menu.
The radar chart is a nice tool to look at the strengths and weaknesses of a pokemon, as the gray areas show how much of each stat the pokemon covers. With it, you can figure out if the pokemon is more of an attacker, or tank, or support, etc.
The trainers I picked for the types are part of the videogames world and I made sure to have representatives for all games, you can see them in the slides below:
Conclusion
That concludes the Pokemon Board experience on Power BI! It’s a fun tool to learn and there is always more that we can put in the board.
Hope you enjoyed! See you next time!
