Board #10: Pokemon Stats and Pokedex on Power BI

Hello!

On this post I bring a new tool to play with: Power BI!

Power BI is a Business Analytics service by Microsoft, and it’s mainly used to produce interactive business reports and visualizations. I started learning it because I thought it would be a good “upgrade” from excel dashboards.

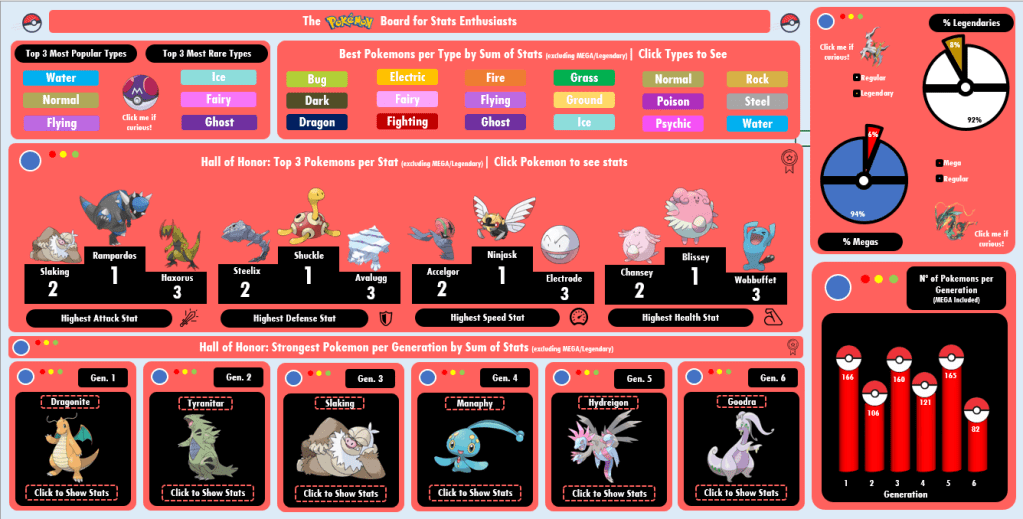
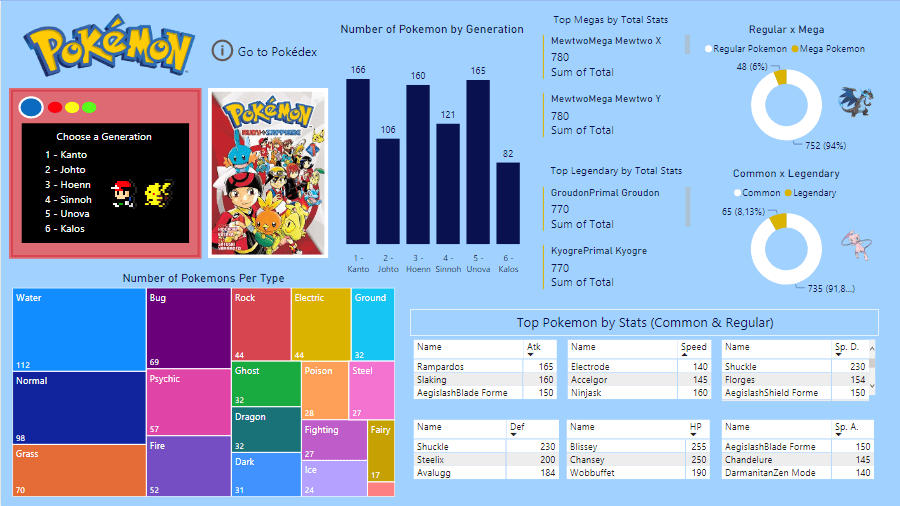
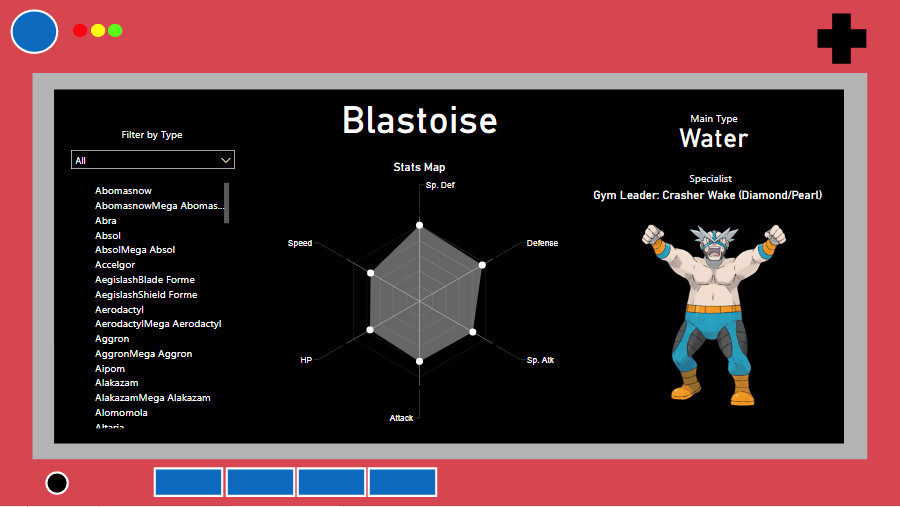
My first Power BI dashboard is about Pokemon, using the same dataset from the Pokemon excel dashboard (check it here). The goal was to create 1 board with general information about pokemon and 1 board to act as a pokedex, so let’s see how they turned out.

Tools used: Power BI – Charts, Cards, Filters

Continue lendo “Board #10: Pokemon Stats and Pokedex on Power BI”

Board #8: Fun with Pokemon Stats!

Hello!

I’m back with one of the things I love the most in the world: Pokemon! #nerd

There was no way I wouldn’t think about practicing Dashboards with Pokemon, so I pushed myself to go far on nostalgia to design this one. I found the dataset online long ago (I believe on Kaggle?) and it contained:

  • Pokemon name, Generation, types (main type, secondary type);
  • If the pokemon is legendary or not; If the pokemon has Mega or not;
  • Pokemon stats: HP, Attack, Defense, Speed, Special Attack, Special Defense, Total.
    • The stats are from the Pokemon Games released for GameBoy/Nintendo DS (Red/Blue, Gold/Silver…)

Tools Used: MS Excel – Pivot Table, Charts; VBA (msgbox)

Continue lendo “Board #8: Fun with Pokemon Stats!”