
Hello!
On this post we’re going to check on my favorite work on Excel so far, and also the biggest one (3 boards). This was done some good time after my last board, which was a time when I was focusing on learning other things, and I believe it shows a lot of growth when we compare it to the previous posts. It’s more analytical, which made me proud and excited to learn more. (:
The data for these boards was a formulary (google forms) answered by 858 people who are part of the r/travel subreddit. It contained a lot of columns, so I’d rather leave the link for you to see here.
My idea for the boards was to:
- 1st: Identify the main persona answering the formulary
- 2nd: Identify their habits when traveling
- 3rd: Cross both information to get some deeper insights
Tools Used: MS Excel – Charts, Pivot Tables; VBA (msgbox)
Questions & Answers
Board #1

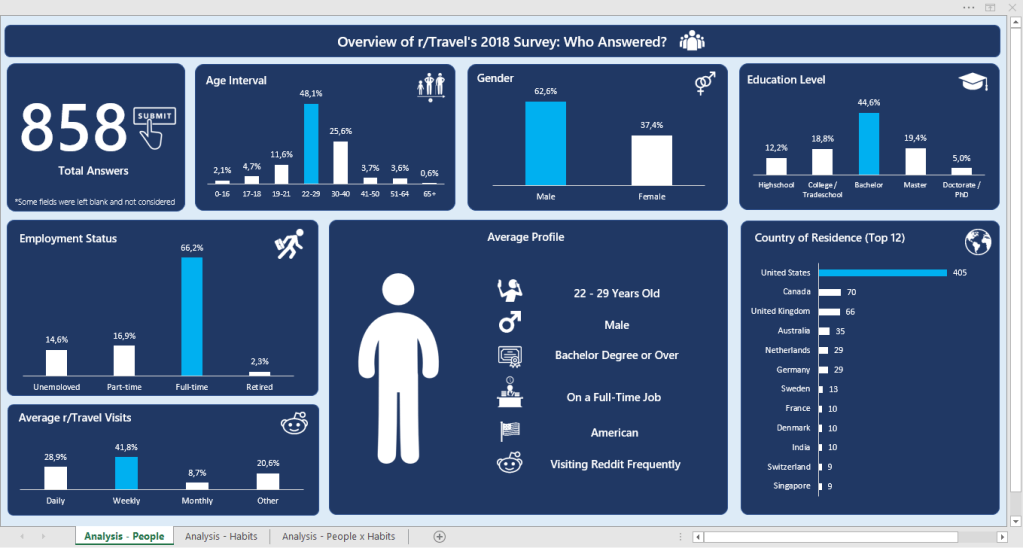
On Board #1 I did some analysis on personal information, such as age, gender, education level, employment status, country, etc. After the analysis (all the charts), I came up with the average profile (center), built by the highlighted blue information.
Board #2

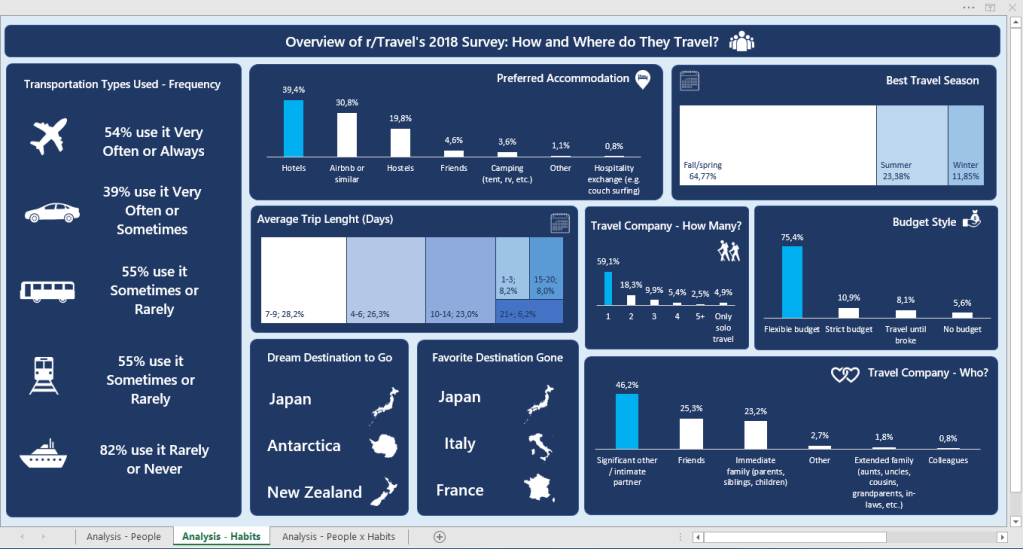
On Board #2, I gathered information related to traveling habits, such as preferred accommodation, travel season, budget syle, travel company, etc. So we see what that persona we built likes:
- Hotels and Airbnb’s are leaders on accommodation options
- Redditors prefer traveling on fall/spring (off season, cheaper?)
- They like traveling with 1 person, usually their significant other
- The focus is to have a flexible budget
- Japan is a star when it comes to tourism
- Planes and Cars are the preferred transportation options
This is all interesting information, but it can go deeper. We can use some personal traits to compare the traveling habits between those traits, and that happens on Board #3.
Board #3
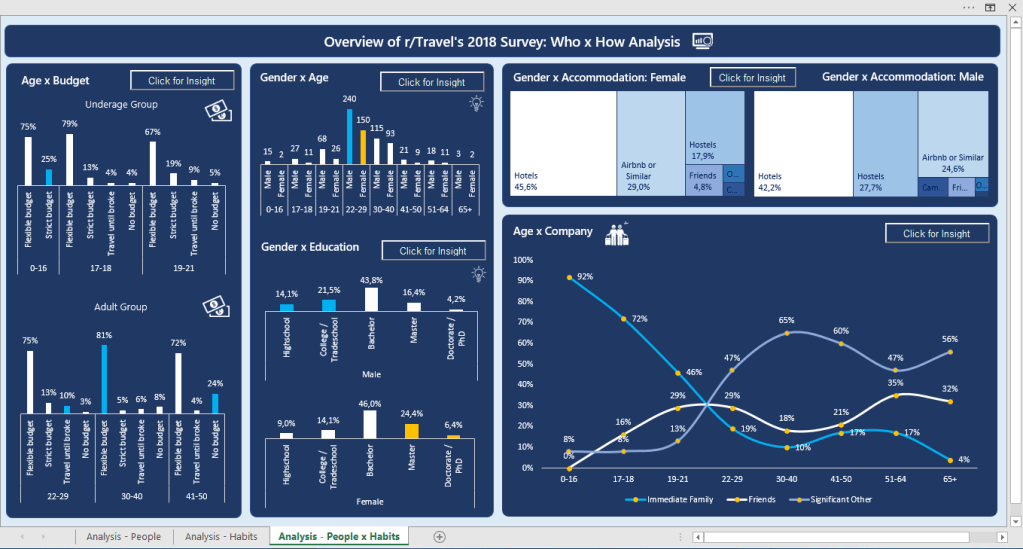
On Board #3 I crossed some information:
- Age x Budget: How does each age interval chooses a budget?
- Everybody has Flexible Budget, but the highest % of Strict Budget is on the 0-16 group (parents control), while the highest % of No Budget is on the 41-50 group (full adults);
- Gender x Age: Both majorities of males and females are in the same age group;
- Gender x Education: There are more males in High School/College than females, but, there are more females in Master/Doctorate than males;
- Gender x Accommodation: Both prefer hotels, but females are more interested on Airbnb than Hostels, while for males is the contrary;
- Age x Company: As age passes, we can see how family (shiny blue) loses priority to friends (white) and significant others (light blue)
See? If there was more space on the board, many more analysis could be done!
VBA Magic: The “Click for Insight” buttons bring explanation about each analysis, so you can understand the purpose of those charts even if you can’t see the relationships between the data.
See you next with Power Bi!
