Hello!
On this post we’re going to check on my favorite work on Excel so far, and also the biggest one (3 boards). This was done some good time after my last board, which was a time when I was focusing on learning other things, and I believe it shows a lot of growth when we compare it to the previous posts. It’s more analytical, which made me proud and excited to learn more. (:
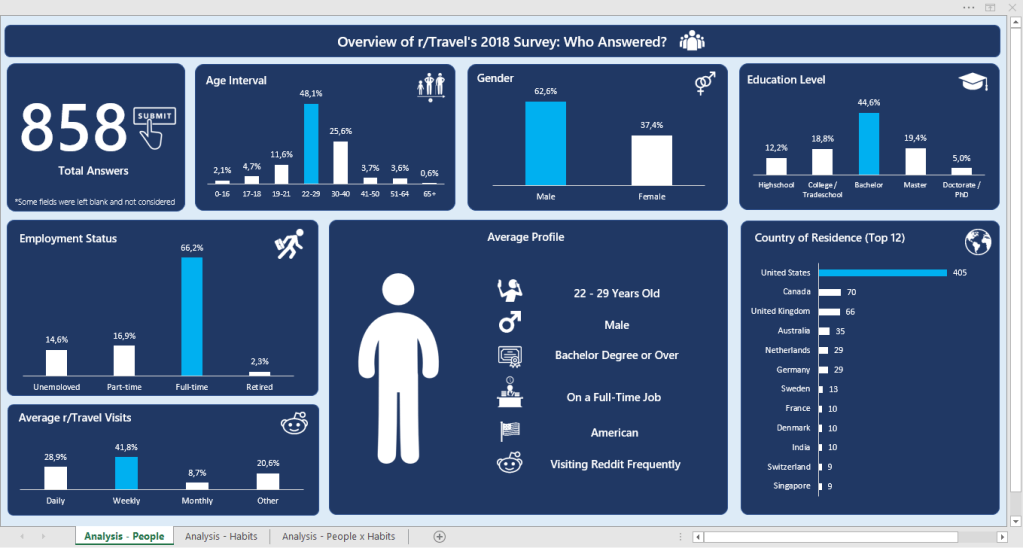
The data for these boards was a formulary (google forms) answered by 858 people who are part of the r/travel subreddit. It contained a lot of columns, so I’d rather leave the link for you to see here.
My idea for the boards was to:
- 1st: Identify the main persona answering the formulary
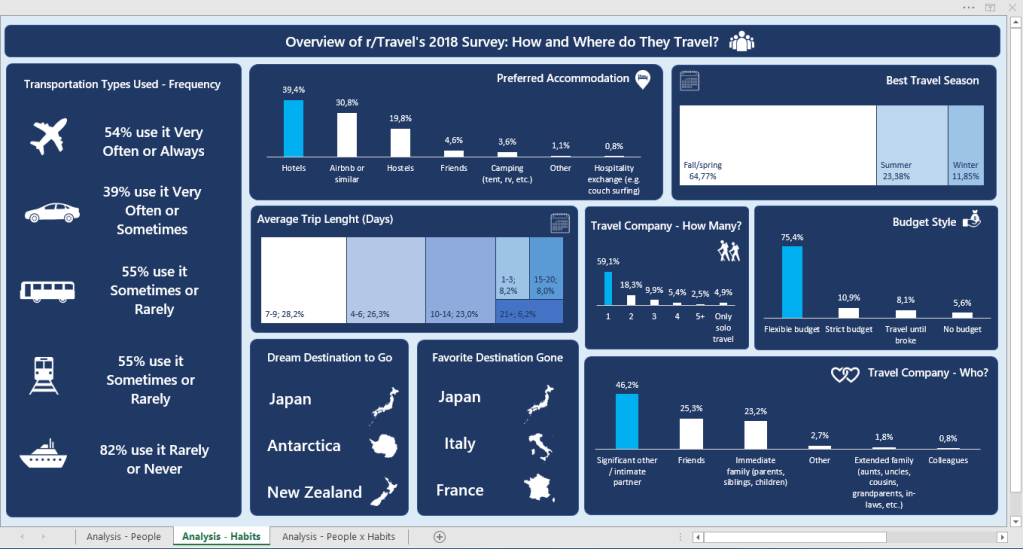
- 2nd: Identify their habits when traveling
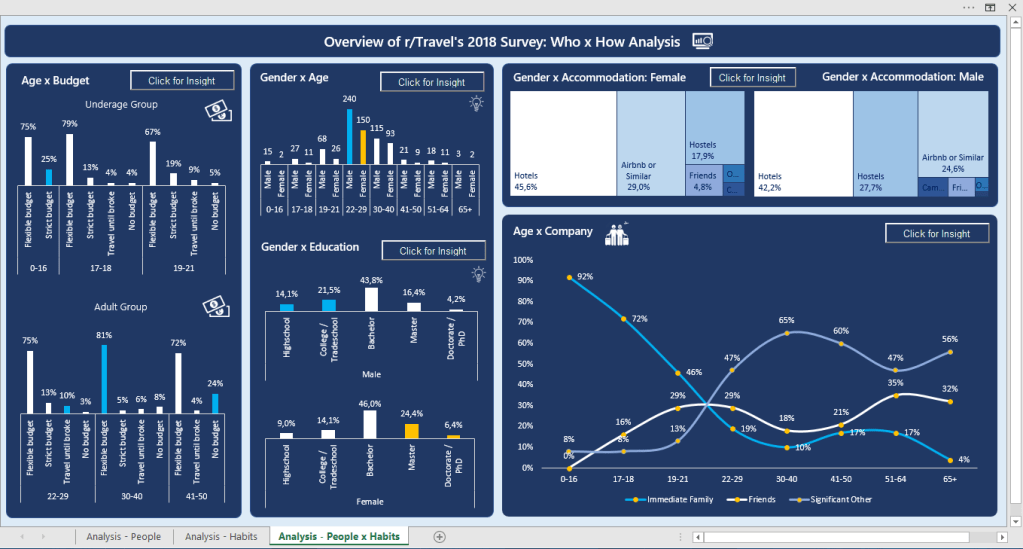
- 3rd: Cross both information to get some deeper insights
Tools Used: MS Excel – Charts, Pivot Tables; VBA (msgbox)
Continue lendo “Board #9: Overview of r/travel’s 2018 Survey”