Hello!
On this post we are going to check on another football dashboard, but this time featuring the german football league: Bundesliga!
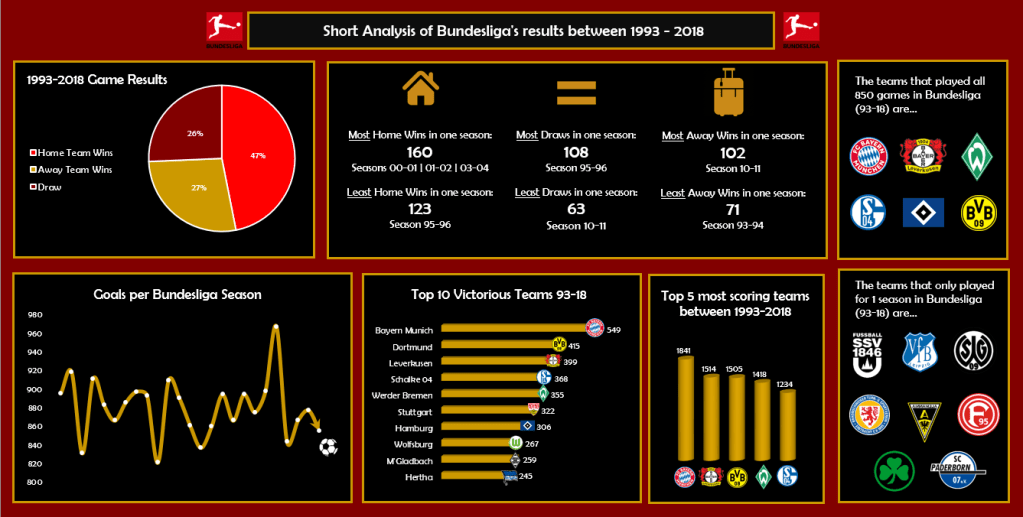
For this analysis we have a long time range, with data from 1993 to 2018, but a shorter number of columns to analyze, being them:
- Date and Season
- Games: Home Team and Away Team
- Scores: Goals from home, goals from away, game winner (Home, Away or Draw)
Tools used: MS Excel – Charts, Pivot Table
Continue lendo “Board #4: Bundesliga Curiosities”