Board #7: Digging Horror Movies Jumpscares

Hello!

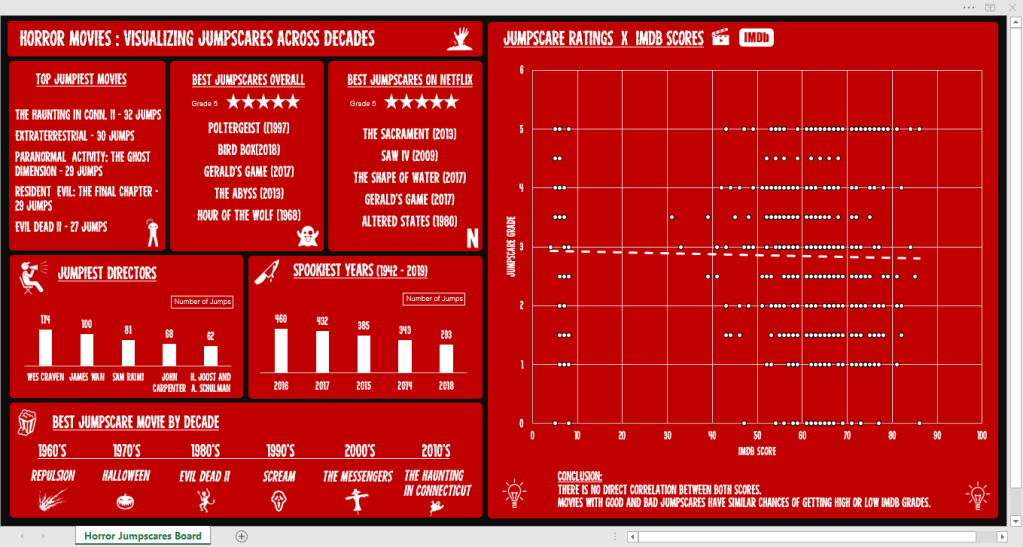
This ~spooky~ board will take us on a knowledge ride about horror movies through 6 decades, bringing informative cards and a chart that brings a simple conclusion.

The dataset used for this is from a challenge offered by r/dataisbeautiful on Reddit and it contains the following columns:

  • Movie, Year, Director
  • Jump count – How many scenes that cause a jumpscare exist
  • Jumpscare rating – If the jumpscares are good (5) or not (1)
  • If it is on Netflix (US) – Yes or No
  • IMDB score – 0 to 100

Tools Used: MS Excel – Charts (Scatterplot, Bars), Pivot Table

Continue lendo “Board #7: Digging Horror Movies Jumpscares”

Board #5: Visualizing Caffeine Presence on Drinks

Hello!

In this post we are going to talk about the presence of Caffeine in certain drinks/substances we take, as well as check the daily limit and the consequences of overdoing it.

The dataset for this came from a challenge on a subreddit (r/dataisbeautiful) and it contains only 3 colums of information, being them:

  • Item (drink, food, medicament, etc)
  • Quantity avaliated
  • Total Caffeine in the quantity
  • Column added by me: Quantity of item until 400mg* of caffeine is reached

*400 mg = Maximum dose of caffeine recommended in 1 day

Tools used: MS Excel – Charts, Pivot Tables, VBA

Continue lendo “Board #5: Visualizing Caffeine Presence on Drinks”

Board #4: Bundesliga Curiosities

Hello!

On this post we are going to check on another football dashboard, but this time featuring the german football league: Bundesliga!

For this analysis we have a long time range, with data from 1993 to 2018, but a shorter number of columns to analyze, being them:

  • Date and Season
  • Games: Home Team and Away Team
  • Scores: Goals from home, goals from away, game winner (Home, Away or Draw)

Tools used: MS Excel – Charts, Pivot Table

Continue lendo “Board #4: Bundesliga Curiosities”