Board #8: Fun with Pokemon Stats!

Hello!

I’m back with one of the things I love the most in the world: Pokemon! #nerd

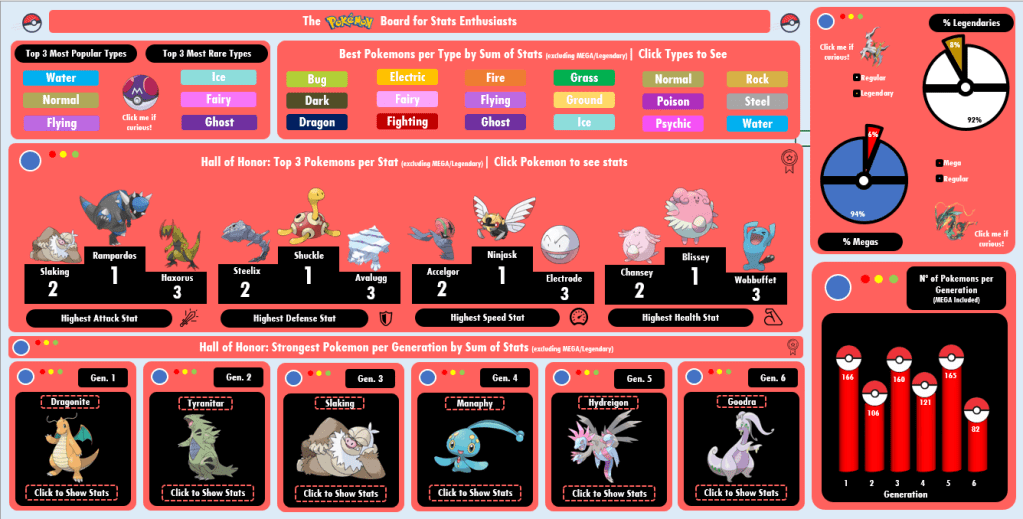
There was no way I wouldn’t think about practicing Dashboards with Pokemon, so I pushed myself to go far on nostalgia to design this one. I found the dataset online long ago (I believe on Kaggle?) and it contained:

  • Pokemon name, Generation, types (main type, secondary type);
  • If the pokemon is legendary or not; If the pokemon has Mega or not;
  • Pokemon stats: HP, Attack, Defense, Speed, Special Attack, Special Defense, Total.
    • The stats are from the Pokemon Games released for GameBoy/Nintendo DS (Red/Blue, Gold/Silver…)

Tools Used: MS Excel – Pivot Table, Charts; VBA (msgbox)

Continue lendo “Board #8: Fun with Pokemon Stats!”

Board #7: Digging Horror Movies Jumpscares

Hello!

This ~spooky~ board will take us on a knowledge ride about horror movies through 6 decades, bringing informative cards and a chart that brings a simple conclusion.

The dataset used for this is from a challenge offered by r/dataisbeautiful on Reddit and it contains the following columns:

  • Movie, Year, Director
  • Jump count – How many scenes that cause a jumpscare exist
  • Jumpscare rating – If the jumpscares are good (5) or not (1)
  • If it is on Netflix (US) – Yes or No
  • IMDB score – 0 to 100

Tools Used: MS Excel – Charts (Scatterplot, Bars), Pivot Table

Continue lendo “Board #7: Digging Horror Movies Jumpscares”

Board #5: Visualizing Caffeine Presence on Drinks

Hello!

In this post we are going to talk about the presence of Caffeine in certain drinks/substances we take, as well as check the daily limit and the consequences of overdoing it.

The dataset for this came from a challenge on a subreddit (r/dataisbeautiful) and it contains only 3 colums of information, being them:

  • Item (drink, food, medicament, etc)
  • Quantity avaliated
  • Total Caffeine in the quantity
  • Column added by me: Quantity of item until 400mg* of caffeine is reached

*400 mg = Maximum dose of caffeine recommended in 1 day

Tools used: MS Excel – Charts, Pivot Tables, VBA

Continue lendo “Board #5: Visualizing Caffeine Presence on Drinks”

Board #4: Bundesliga Curiosities

Hello!

On this post we are going to check on another football dashboard, but this time featuring the german football league: Bundesliga!

For this analysis we have a long time range, with data from 1993 to 2018, but a shorter number of columns to analyze, being them:

  • Date and Season
  • Games: Home Team and Away Team
  • Scores: Goals from home, goals from away, game winner (Home, Away or Draw)

Tools used: MS Excel – Charts, Pivot Table

Continue lendo “Board #4: Bundesliga Curiosities”

Board #3: Curiosidades do Brasileirão

Olá!

Neste post vamos falar sobre o esporte mais “cultuado” no Brasil, o futebol, utilizando dados sobre as edições do Brasileirão entre 2008 e 2017. Diferente dos boards anteriores, este é estático, ou seja, não tem filtros que modifiquem os gráficos.

Dados disponíveis:

  • Anos, times, posições
  • Número de jogos, vitórias, derrotas e empates
  • Saldo de gols, gols sofridos, gols feitos
  • Número de jogadores geral e estrangeiros, idade média dos jogadores

Ferramenta utilizada: MS Excel – Gráficos e Tabela Dinâmica

Continue lendo “Board #3: Curiosidades do Brasileirão”

Board #2: Análise de Vendas Simples

Olá!

Nosso board nº 2 é uma simples planilha com informações de vendas de uma empresa “X”, onde encontramos:

  • Totais de vendas por vendedor, produto e mensal
  • Vendas por estado e região do Brasil
  • Vendas por cliente

Este board foi feito por mim como prática durante o curso de Excel + Dashboards, realizado em 2019.

Ferramenta utilizada: MS Excel – Tabela Dinâmica, Gráficos, Slicers

Continue lendo “Board #2: Análise de Vendas Simples”

Board #1: Minhas Corridas de Uber

Olá!

E o primeiro post do blog vai para………..o meu primeiro Dashboard!

Esse dashboard foi construído em Novembro/2019, com dados que obtive da minha conta no aplicativo Uber. Essas foram as informações que consegui:

  • Data de cada corrida
  • Modelo de carro de cada corrida
  • Nome do motorista
  • Percurso
  • Valores

Motorista, Percurso e Valores eram informações que não combinavam muito com as perguntas que eu queria me responder com o dashboard. Sendo assim, foquei o dashboard apenas nos primeiros 2 pontos: Datas e Modelos.

Ferramentas Utilizadas: MS Excel – Gráficos, Tabelas Dinâmicas, Slicer

Continue lendo “Board #1: Minhas Corridas de Uber”