
Hello!
This time I bring a purple board with some simple charts reflecting the sales market of “Oak Company”.
The dataset for this board contains some localization columns, product related columns and sale price/cost price. With them, we can have an overview of the performance of different cities and products, as well as the view of the revenues through time.
Analysis
- How did the results in São Paulo state look like? They are our biggest market!
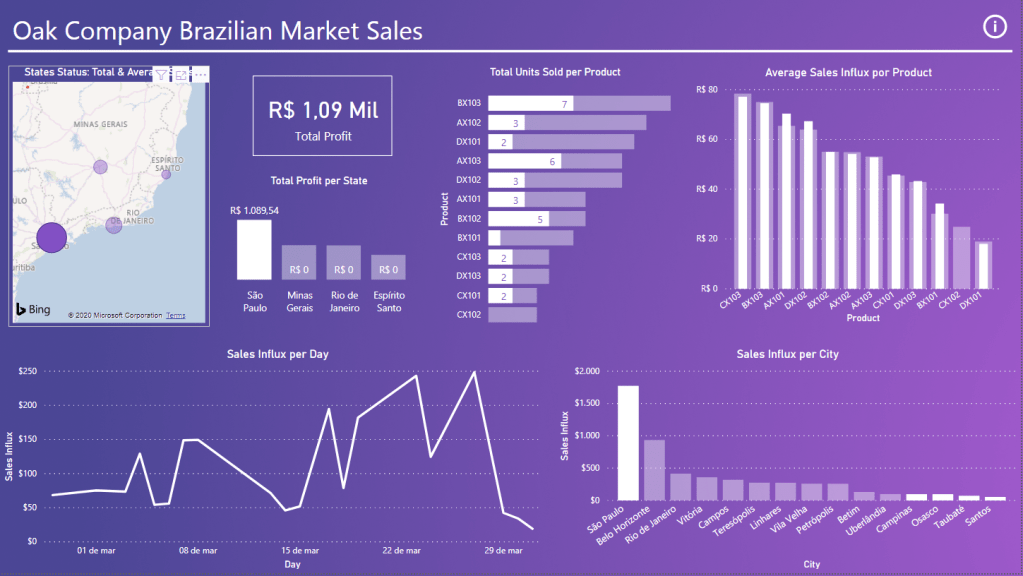
- Selling a little from almost every product;
- Selling almost 50% of the most sold product (BX103);
- Most sales are in the capital city (São Paulo);
- The revenues had many highs and lows through the month, peaking twice in the last week (22-29 March), but then falling to the worst result in the beginning of april.
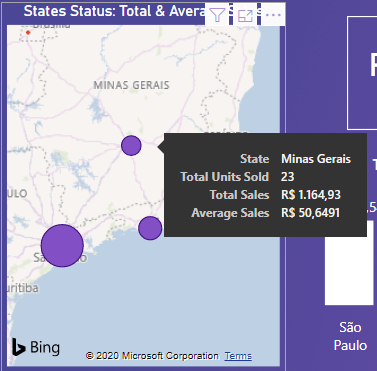
2. What are the total and average sales of Minas Gerais state?
3. How is the performance of our most sold product, BX103?
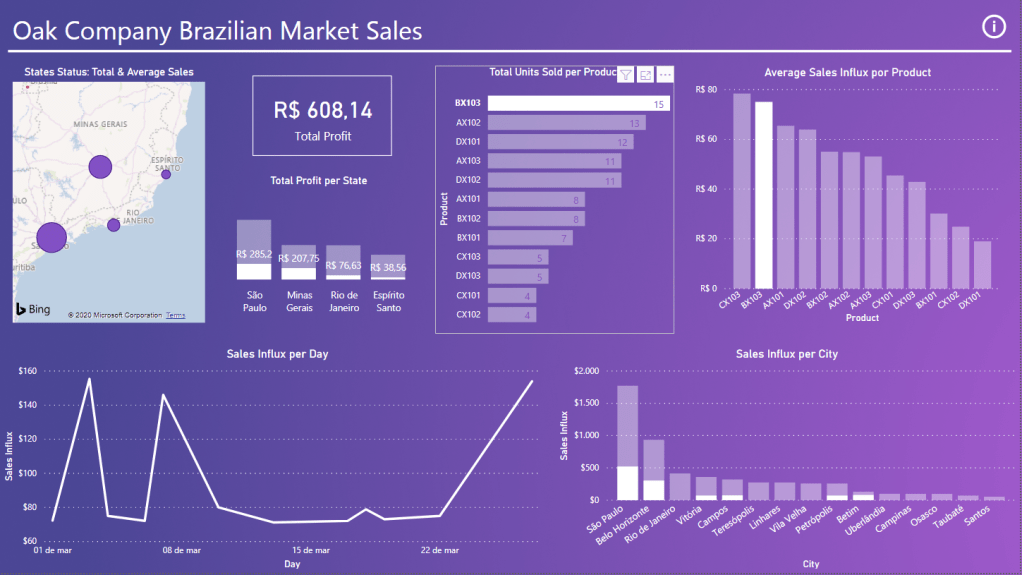
- The product is the most sold in São Paulo and Minas Gerais states;
- It brings good profit for the company and in every state;
- Though its the most sold in units, it has a smaller average sales revenue than CX103;
- Peaks in the beginning and end of the month.
4. How was the performance on march 28th?
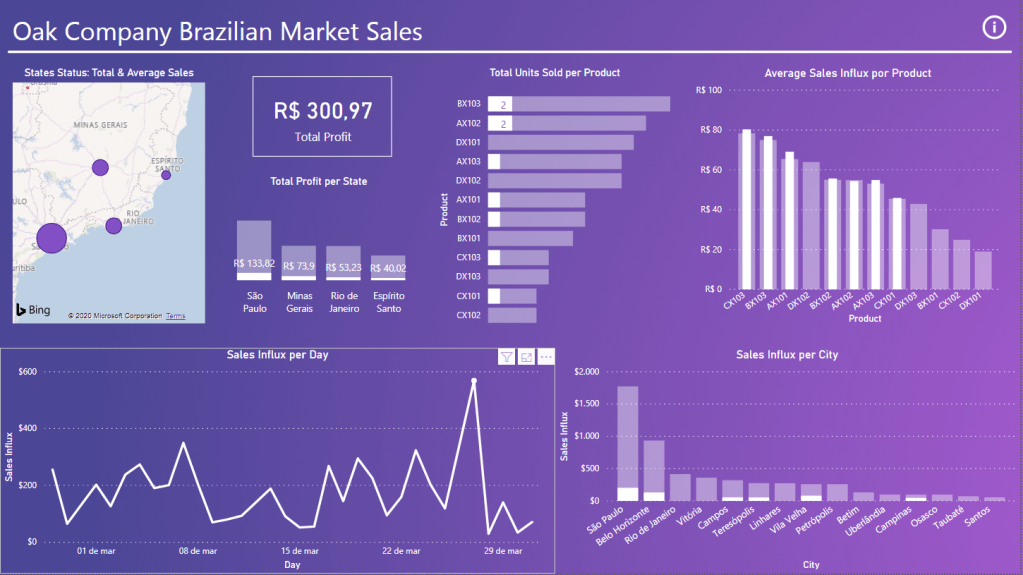
- That date holds the sales peak of the month, more than doubling the results from the previous days;
- São Paulo state had the most sales and profit, but the other states were also positive;
- 7 different products were sold, being 2 units each of BX103 and AX102;
- Some countryside cities also were able to sell that day, such as Campinas, Vila Velha, Teresópolis, and Campos
Conclusion
The board looks simple, but it can give good information to the ficticious company. Through that, they can understand on which cities they can focus their marketing, how much of each product they must produce/buy, how their revenue stream works, and many more factors on their business.
See you next!
